 Grafana
| Description / name | Input element |
|---|---|
| Container Registry | |
| Container Configuration Root Path | |
| Timezone | |
| User ID | |
| Group ID | |
| Grafana Host Port | |
| Grafana /config Path |


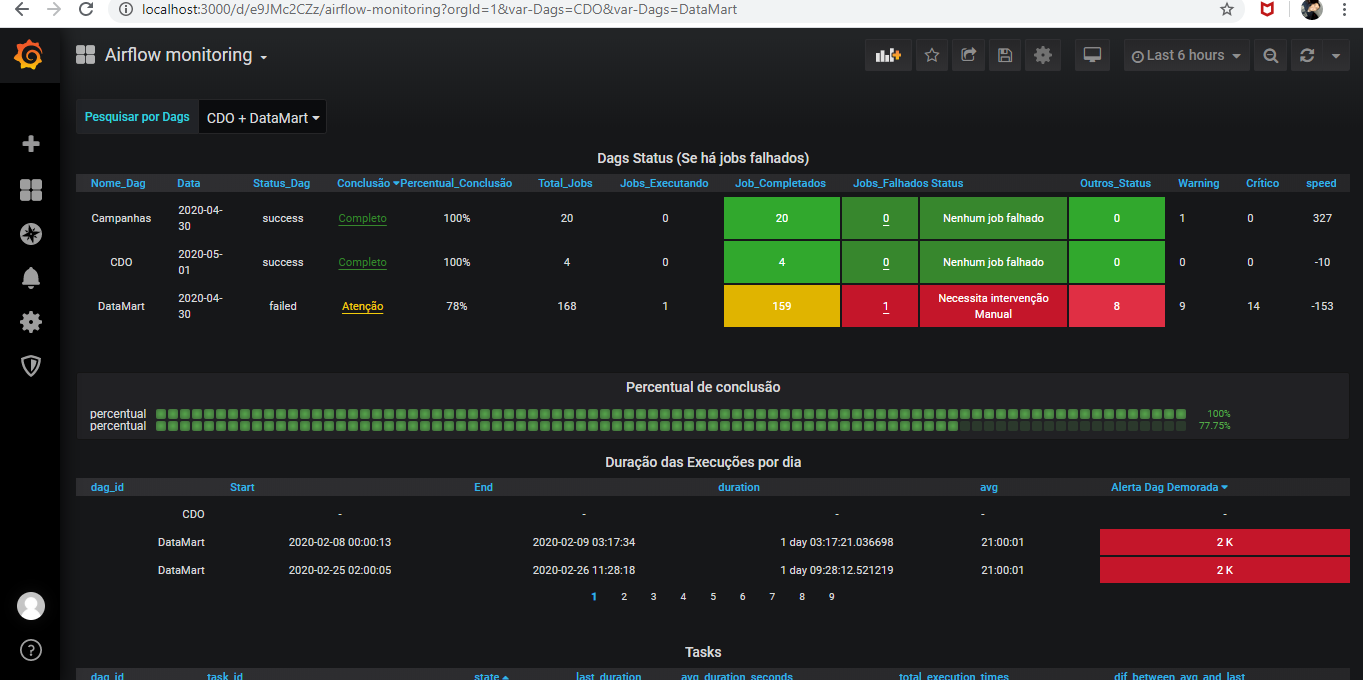
Grafana is an open source and composable observability and data visualization platform. Visualize metrics, logs, and traces from multiple sources like Prometheus, Loki, Elasticsearch, InfluxDB, Postgres and many more.
| Port | 3000 |
| Registry | ghcr.io/daemonless/grafana |
| Daemonless | daemonless/grafana |
| Source | grafana/grafana |
| Website | grafana.com/grafana |
Version Tags
| Tag | Description | Best For |
|---|---|---|
latest / pkg |
Installed from the FreeBSD quarterly package repository. | Most users. Matches Linux Docker behavior. |
pkg-latest |
Installed from the FreeBSD latest package repository. | Alternative build. |
Root Privileges Required
Podman on FreeBSD currently requires root. All commands must be run as root (or via doas/sudo).
Before deploying, ensure your host environment is ready. See the Quick Start Guide for host setup instructions.
Deployment
Access at: http://localhost:3000
Interactive Configuration
Parameters
Environment Variables
| Variable | Default | Description |
|---|---|---|
PUID |
1000 |
User ID for the application process |
PGID |
1000 |
Group ID for the application process |
TZ |
UTC |
Timezone for the container |
Volumes
| Path | Description |
|---|---|
/config |
Configuration, data, logs, plugins and provisioning |
Ports
| Port | Protocol | Description |
|---|---|---|
3000 |
TCP | Web UI |
Implementation Details
- Architectures: amd64
- User:
bsd(UID/GID set via PUID/PGID). Defaults to1000:1000. - Base: Built on
ghcr.io/daemonless/base(FreeBSD 15.1).
Need help? Join our Discord community.